PREDIABETES
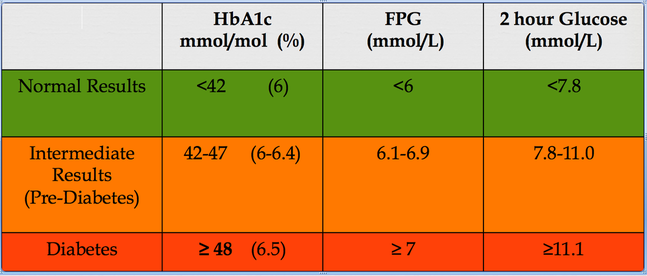
The above table should be fairly self explanatory as to what prediabetes is. But controversy remains as to what it does!
Is there a need to have a prediabetes category? Are we able to diagnose it accurately in everyone? Does it inevitably progress to diabetes? If so, what is the risk of that happening annually? How many people regress to normal glycaemia every year? What does it take to do that? Does prediabetes carry the same or lower risk as overt diabetes? for both macro and microvascular complications? Do the medications that work for diabetes work for the prediabetes state as well in preventing complications? I will try to answer these questions at this site....But first a bit of history and a look at some concepts to understand the factors contributing to a rise in fasting versus postprandial glucose levels in man.
IGT
Impaired Glucose tolerance (IGT) was recognised as "Borderline diabetes" by WHO expert committee on diabetes mellitus in 1980.In the broad sense, impaired glucose tolerance should encompass any abnormality in glucose handling. It is unfortunate that this term has become deeply embedded as a means of describing patients with a 2 hour value on OGTT between 7.8 and 11.1, and continues to cause significant confusion in communication. At this site, IGT is used to signify the 2-hour OGTT abnormality, while IFG denotes Impaired Fasting glucose (fasting glucose from 6.1-6.9) , NGT denotes Normal glucose Tolerance and NFG for Normal Fasting Glucose.
Prevalence and progression
Obesity is increasing in epidemic proportions and with it, IGT. About 16 million people in the United States have IGT, according to the National Health and Nutritional Examination Survey III. Financial and manpower implications on screening and treatment are obvious. The world is not yet ready to actively screen for and start measures to combat impaired glucose tolerance.
20 to 30% of patients with impaired glucose tolerance have associated impaired fasting glucose. impaired glucose tolerance is commoner in women and increases with age.
Impaired glucose tolerance has a1.5 to 2.4-times increased risk of developing diabetes.
2-5% of IGT progress to diabetes every year.
Risk of conversion to diabetes during 6 year follow up: HOORN study
Normals: 7.0/1000 person years
IFG: 51.4/1000 person years
IGT: 57.9/1000 person years
In the DPP study, about 10 percent of participants in the placebo or standard group developed diabetes per year
Only 8% in the study had IGT but, 40% of incident DM was in IGT patients
Predictors of progression to diabetes from NGT: (Diabetes. 1990 Mar;39(3):283-8)
Fasting glucose levels
Fasting insulin levels
BMI
Age
22% of individuals classified as IFG would be reclassified into another category while only 10% of those diagnosed as IGT would be reclassified on further testing demonstrating the greater reliability of a diagnosis of IGT. It should be kept in mind that sugary solutions are not what we have on a daily basis. Studies using mixed meals to assess glucose intolerance have shown less variation on repeat testing and is hence more consistent in the critical IGT range. Diabetes Care.1998 Mar;21(3):336-40. Also crucial is the fact that glucose tolerance test does not merely test the insulin secretory ability, but in fact the whole range of abnormalities in diabetes including gastric emptying, postprandial absorptive ability of glucose from the intestines, the degree of gut glucose utilisation, postprandial suppression of glycogenolysis and gluconeogenesis (hepatic insulin resistance) and the ability to increase postprandial peripheral glucose disposal (muscle insulin resistance).
IGT was considered more a risk factor than a disease in its own right by the WHO expert committee on diabetes mellitus in 1980. So why the hue and cry about Impaired glucose tolerance? Is it all about the concern of progression to diabetes? Or does IGT itself produce deleterious health effects? Various studies have shown that IGT can independently predict increased cardiovascular risk. The HOORN study, Diabetologia. 1999 Aug;42(8):926-31 the HONOLULU heart programme, Diabetes. 1987 Jun;36(6):689-92, the Chicago Heart Study, Diabetes Care. 1997 Feb;20(2):163-9 the DECODE study Lancet. 1999 Aug 21;354(9179):617-21. the Diabetes Intervention Study Diabetologia. 1996 Dec;39(12):1577-83. meta-analysis of the Whitehall Study, the Paris Prospective Study, and the Helsinki Policemen Study Diabetes Care. 1998 Mar;21(3):360-7. and meta- analysis of other studies Diabetes Care. 1999 Feb;22(2):233-40. have all demonstrated this predictive ability of 2 hour glucose levels on cardiovascular risk and even atherosclerosis progression. Atherosclerosis. 1999 May;144(1):229-35. IGT may be an independent predictor of CHD irrespective of progression to frank diabetes (Diabetes Care. 2003 Oct;26(10):2910-4. Cardiovascular risk is even stronger when IGT coexists with IFG. Predictive properties of impaired glucose tolerance for cardiovascular risk are not explained by the development of overt diabetes during follow-up and hence waiting to find out whether a patient progresses into frank dysglycaemia is probably not warranted. If this is indeed the case, shouldn't we be decreasing the threshold for diagnosing "diabetes" on the GTT? Apart from confusing the world population with yet another change in diabetic diagnostic criteria, the economic, emotional , educational, ethical and legal burden would be massive.
Can we predict who will progress from NGT (normal glucose tolerance) to IGT? Not all patients with IGT progress to diabetes either. Is it possible to predict progressors in this subgroup? Studies seem to suggest that high fasting insulin levels (indicator of insulin resistance) and low 30 minute insulin levels after GTT (indicator of first phase insulin response) are independent predictors of progression of NGT to IGT. Diabetologia. 1996 Oct;39(10):1201-7. ; Diabet Med. 1990 Jun;7(5):407-13. The ratio of the incremement in plasma insulin to plasma glucose at 30 minutes on an OGTT is called the insulinogenic index. Lower the insulinogenic index, higher the risk/chance of progression to IGT. Diabet Med. 1996 Sep;13(9 Suppl 6):S109-19.
What does IFG and IGT signify? Do they identify the same kind of patients merely in different stages of diabetes in its natural history? J Diabetes Complications.2001 Jan-Feb;15(1):34-7. Or does it identify patients of different metabolic characteristics or different types of defects? Not all diabetic patients pass through stages of IFG, IGT, and later both , followed by blood sugars in the range defining type 2 diabetes. Clearly, there are patients who have normal fasting blood sugar but 2-hour post prandial sugar in the diabetic range. This in itself could suggest that IFT and IGT could be the result of different metabolic characteristics rather than different stages in the disease.
So what determines whether a patient develops IFG or IGT first before progression to type 2 diabetes? To try to understand this, one has to ask as to what determines fasting and post prandial blood sugars; insulin resistance or insulin secretion? Or to rephrase the question, which of the two factors (insulin resistance or secretion) makes a greater contribution to fasting and postprandial sugars? One could be forgiven for assuming that postprandially the failing pancreas cannot cope with the glycaemic load and hence insulin levels are inadequate making insulin secretion the major determinant of postprandial glycaemia. But on OGTT, IGT patients tend to have higher insulin levels than IFG patients! Conversely one would simplistically assume that fasting reduces the glycaemic load on the pancreas and hence insulin resistance would come into play to a greater degree during fasting when the demand on the pancreatic secretion by a glycaemic load is minimal! Yet studies seem to show that a beta cell secretory defect predominantly contributes to fasting hyperglycaemia. The concept is far from simple.
Many studies have tried to delineate the individual contributions of the two pathologies to blood sugar values in the postabsorptive (fasting) and fed (postprandial) states. One of the important concepts is one of insulin/glucose ratio. It is no news that for any level of glycaemia, the insulin secretion in the diabetic is less than ideal, or in other words a relative insulin deficiency. It is important to keep this in mind while interpreting insulin secretion levels in IFG or IGT states. This would explain why the IGT patient who has a higher glucose value at 2 hours than an isolated IFG patient, has a higher insulin level............,
|
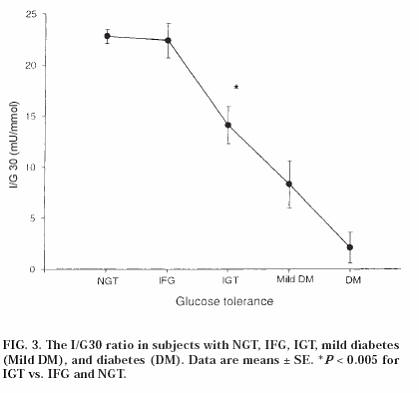
source: DIABETES, VOL. 49, JUNE 2000
|
The I/G30 represents the insulin to glucose ratio at 30 minutes. A failure of the first phase of insulin is a characteristic defect in type 2 diabetics which as mentioned above can in fact predict who will progress to IGT from normal glucose tolerance. But the early insulin secretory defect is translated into high blood sugars postprandially, as insulin is unable to suppress the basal EGO (endogenous glucose output) from the liver which is the major contributor to postprandial hyperglycaemia. So hepatic insulin resistance clearly contributes significantly to the failure of insulin to suppress postprandial sugars. The resultant high sugars that occur (due to decreased first phase response and hepatic resistance to insulin action) produce a sustained stimulus to the beta cell such that insulin levels remain higher for longer. In the patient with isolated IGT, this sustained rise in postprandial insulin manages to keep the fasting sugar in the normal range when the postprandial load is slowly disposed of. Through the night, insulin secretion continues stimulated by the level of glycaemia such that morning insulin levels are a good measure of insulin resistance.
The insulin secretory defect is thus normal in the NGT patient, lower in the IFG patients, and reduced further in the IGT patient and most markedly reduced in diabetic patients. Diabetes. 2002 Feb;51 Suppl 1:S265-70. A combination of abnormalities happens when the secretory defect is worse. Thus IFG+IGT patients have lower first phase insulin secretory ability than patients with isolated IGT [when insulin sensitivity index and second phase secretion are comparable]. Isolated IGT patients have a lower first phase insulin secretory ability (beta cell function) than Normal controls.
Transition from NGT to IGT is associated with:
-increased BMI
- decreased insulin-stimulated glucose disposal
-and reduction in acute insulin response (AIR) to intravenous glucose
-No change in basal EGO
Transition from IGT to florid diabetes is characterised by
-further increase in BMI
-further decrease in insulin-stimulated glucose disposal
-predominantly a decrease in AIR much more than a decrease in insulin sensitivity
-increase in basal EGO.
ref: J Clin Invest. 1999 Sep;104(6):787-94.